
Copyright © 2017-2018 Negin Jahanmiri & Deep-r All rights reserved.
Deep-r:
User Dashboard
User Dashboard
I joined a UX Designer and a UX Researcher, in a 3-week project, to help Deep-r design a customizable dashboard for executives and engineers in Oil & Gas industry, so that they could see all the complex data they need in one central location, which would help them make quick and accurate data driven decisions.
We spent three weeks, researching the industry, learning about best practices in designing B2B complex dashboards, and speaking with data scientists and engineers, who could be the potential end users. We then gathered our research findings and used all the info to create a customizable dashboard and a simulation page, which would allow users to explore scenarios and options to improve operational efficiency.
The executives at Deep-r very happy with our work. At the end of our presentation, one of the founders said: “You took our vision and gave us something better!”, which made us feel very happy and accomplished, as we had fulfilled our duty as UX consultants.

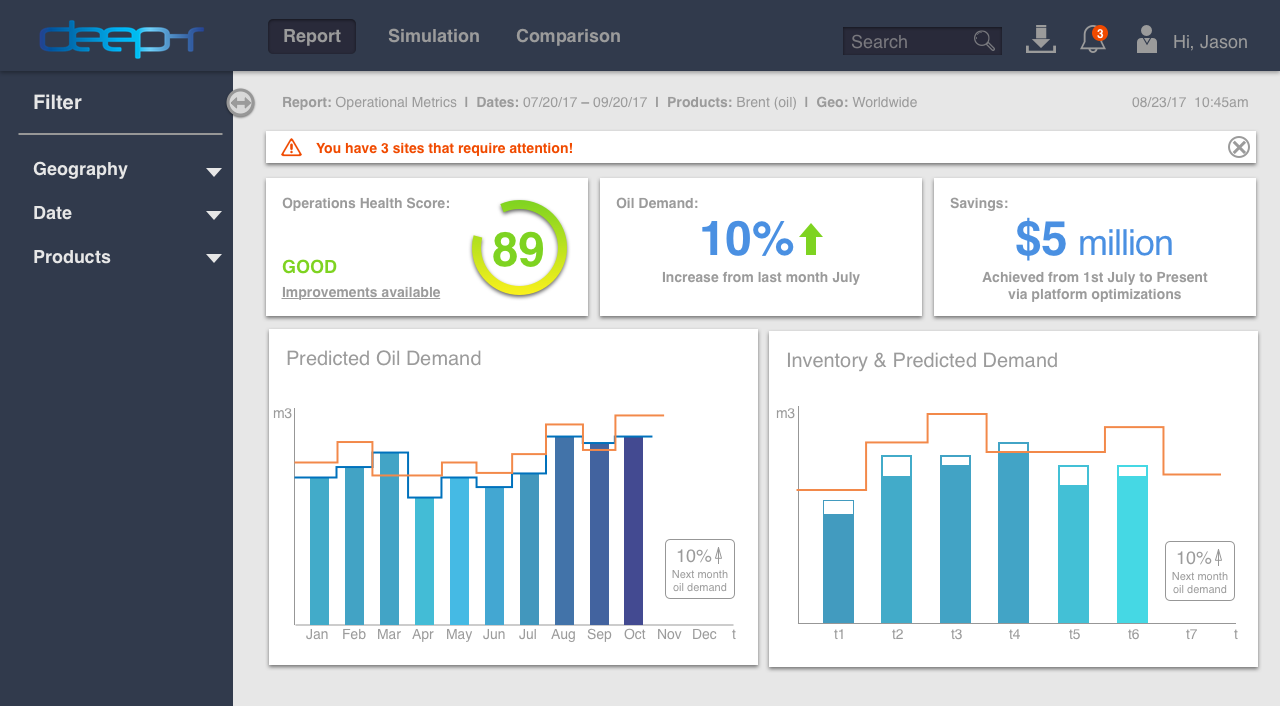
Deep-r Dashboard
Light Background
Light Background
By using Artificial Intelligence and open source machine learning algorithms, Deep-r was planning to:
Present client, economic, and commodity data at a national, state and oil terminal storage specific level
Provide a high tech (think Minority Report!) interactive dashboard for the oil supply chain from refinery to gas station
Present client, economic, and commodity data at a national, state and oil terminal storage specific level
Provide a high tech (think Minority Report!) interactive dashboard for the oil supply chain from refinery to gas station
We had no idea what “Minority Report” was, but that did not stop us...
Based on what we heard during our first meeting with Deep-r executives, we formed a hypothesis that we had to design two completely different dashboards and experiences to feed two different end users that Deep-r team had described.
Research
We started with heuristic evaluation of the early stage product screenshots provided by Deep-r team. We then searched for companies that were using machine learning and Artificial Intelligence in Oil & Gas industry. We could not find a direct competitor with similar product to what Deep-r is building.
We started with heuristic evaluation of the early stage product screenshots provided by Deep-r team. We then searched for companies that were using machine learning and Artificial Intelligence in Oil & Gas industry. We could not find a direct competitor with similar product to what Deep-r is building.
Challenge
How can we help oil companies make sense of complex data to make better decisions?
How can we help oil companies make sense of complex data to make better decisions?
Oil & Gas Industry
To refine our assumptions and fill in the blanks, we spoke with people in oil and gas industry, which helped us understand how the industry is organized and the most common problems people often face in the industry. We found out that:
To refine our assumptions and fill in the blanks, we spoke with people in oil and gas industry, which helped us understand how the industry is organized and the most common problems people often face in the industry. We found out that:
All oil and gas metrics are strongly tied to geography.
Supply and demand for oil & gas varies by geography (the oil and gas network is very complex)
The operational and reporting structure also varies within an oil and gas company.
Supply and demand for oil & gas varies by geography (the oil and gas network is very complex)
The operational and reporting structure also varies within an oil and gas company.
Oil companies collect large volumes of operational data and often struggle to filter and organize this data in an effective way to inform their decision making. Some common tools used in the industry include:
Spotfire & SAP for BI
Excel for Simulations
Tableau for Data Visualization
Powerpoint for executive communication with board members
Spotfire & SAP for BI
Excel for Simulations
Tableau for Data Visualization
Powerpoint for executive communication with board members
Best Practices
Through our research on best practices for dashboards, we found out that effective dashboards are not read only. Users need to be able to see the most important thing you want them to see and should also be able to act upon it. Alerts and notifications help draw users’ attention to the most pressing matter. Micro animation and confirmations help communicate with users that the tasks they performed were either completed successfully or warn them if they need to redo or change anything.
Through our research on best practices for dashboards, we found out that effective dashboards are not read only. Users need to be able to see the most important thing you want them to see and should also be able to act upon it. Alerts and notifications help draw users’ attention to the most pressing matter. Micro animation and confirmations help communicate with users that the tasks they performed were either completed successfully or warn them if they need to redo or change anything.
Since different user have different needs and priorities, it is highly recommended that dashboard are customizable, where users could add or remove panels when they need to, in addition to being able to move the panels around and sort them based on their often use. You do not have to show everything on one page. Less frequently used items could be sorted under different menus. The use of clear iconography can help save more space, and you do not try to fill empty space with unnecessary items.
Interviews & Insights
One of the challenges we were facing was the fact that we were not able to directly speak to Deep-r’s clients and we had to improvise. While Deep-r only focuses on midstream, the participants of our study were mainly working on upstream. We gathered insights from:
Location Manager (Schlumberger)
Former Engineer (Exxonmobil)
Former Engineer (Chevron)
Product Manager (Seven Lakes with background in Oil & Gas)
Data Analytics/Production Engineer (eLynx Technologies)
Former Senior Oil & Gas Analyst Consultant
Engineer (2H Offshore)
Personas
We synthesized our findings into two personas, which helped us keep our end users in mind during our design process.
We synthesized our findings into two personas, which helped us keep our end users in mind during our design process.

Deep-r Dashboard
Primary Persona 1
Operations Executive
Primary Persona 1
Operations Executive

Deep-r Dashboard
Primary Persona 2
Operations Analyst
Primary Persona 2
Operations Analyst
Solution
If we create a customizable and scalable user-friendly dashboard, we can help our end users view all the data they need at once and in one place, which will help them make quick data-driven decisions to increase efficiency of their department and eliminate unnecessary costs.
If we create a customizable and scalable user-friendly dashboard, we can help our end users view all the data they need at once and in one place, which will help them make quick data-driven decisions to increase efficiency of their department and eliminate unnecessary costs.
Data Visualization
We interviewed data scientists and conducted secondary research on dashboard, data visualization, and organizing complex data best practices. The results led us to our concept, mock ups, and scenarios.
We interviewed data scientists and conducted secondary research on dashboard, data visualization, and organizing complex data best practices. The results led us to our concept, mock ups, and scenarios.
Desktop View
Different users, even within the same company, need to access different type of data when using the dashboard, which means they would have different KPIs, and different views
Different users, even within the same company, need to access different type of data when using the dashboard, which means they would have different KPIs, and different views
We aimed to design functionality to meet different users’ needs:
Executives would want a top level view of their KPIs
Operations would need to have the ability to drill down to explore scenarios
Executives would want a top level view of their KPIs
Operations would need to have the ability to drill down to explore scenarios
Co-Creation
In spite of all the research we conducted, there were still many unsolved puzzles and confusions when it came to KPI prioritization and the type of data we were supposed to visualize. We were also working with placeholder contents and needed more clarification. Since we did not have any access to our end users or their real data, we asked our client to co-create with us and help us choose from various options we had came up with during our own brainstorming session.
In spite of all the research we conducted, there were still many unsolved puzzles and confusions when it came to KPI prioritization and the type of data we were supposed to visualize. We were also working with placeholder contents and needed more clarification. Since we did not have any access to our end users or their real data, we asked our client to co-create with us and help us choose from various options we had came up with during our own brainstorming session.
Deep-r Dashboard
Co-Creation with the client
Dashboard Concept
Co-Creation with the client
Dashboard Concept
Anyone who might use our dashboard should be able to:
Consolidate data into one central location
Visualize key performance indicators
Filter information by geography, product, and date
Organize reports based on functional requirements
Customize the dashboard based on role requirements
View and download standard reports and charts with the ability to customize (Examples: Executive Metrics, Supply vs Demand, Supply and Storage, Market Insights)
Deep-r Dashboard
Light Background
Light Background
Personalized Experience
In addition to suggest customization as part of functions for dashboard panels, and out of our respect to Minority Report and all the other high tech spy movies, we designed two versions of dashboards with light and dark backgrounds for the users to choose from.
In addition to suggest customization as part of functions for dashboard panels, and out of our respect to Minority Report and all the other high tech spy movies, we designed two versions of dashboards with light and dark backgrounds for the users to choose from.

Deep-r Dashboard
Dark Background
Dark Background
Sandbox
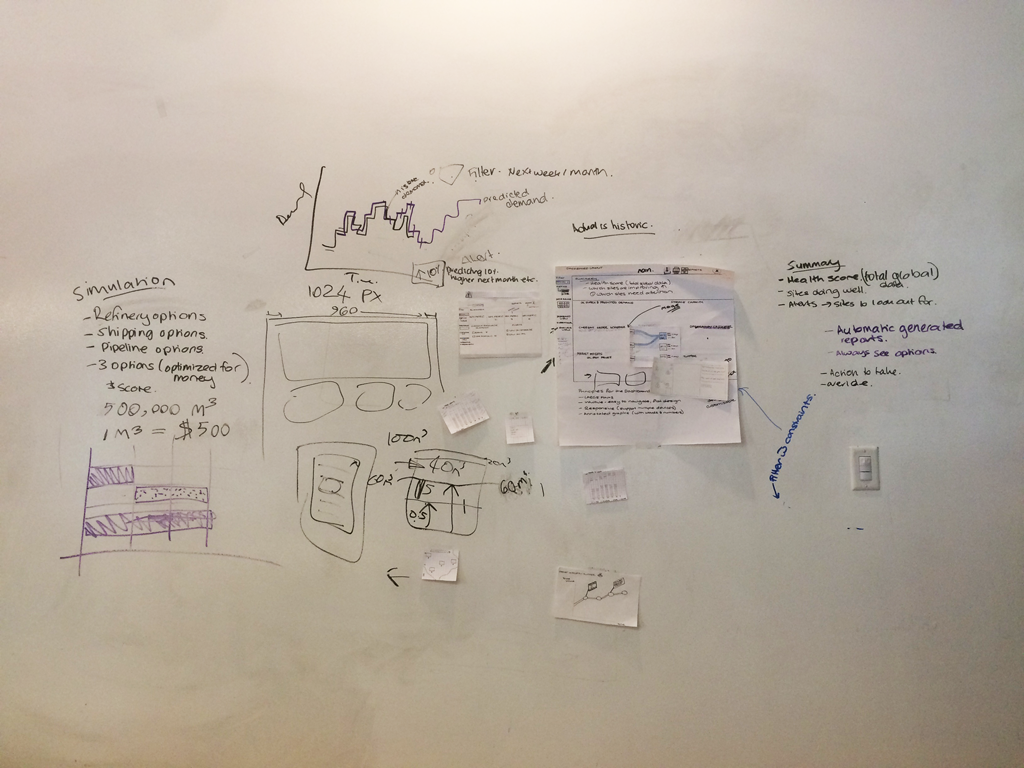
Deep-R executives had an amazing vision, which they referred to as “Sandbox”. Aside from the main dashboard, they asked us to design an environment, where the users could explore different scenarios to choose the most cost and time efficient way to deliver different products (different brands of oil & gas) from the refinery to the storage terminal and would see different consequences should they choose to act upon the options that sandbox would suggest.
Deep-R executives had an amazing vision, which they referred to as “Sandbox”. Aside from the main dashboard, they asked us to design an environment, where the users could explore different scenarios to choose the most cost and time efficient way to deliver different products (different brands of oil & gas) from the refinery to the storage terminal and would see different consequences should they choose to act upon the options that sandbox would suggest.
Gamestorming
Since the Sandbox concept was very vague in the beginning, we asked our client to Gamestorm with us. The purpose of this gamestorming was to break the ice, create more clarity in terms of scope and what was achievable in a 2-week sprint, and help our client answer two main questions for us:
Since the Sandbox concept was very vague in the beginning, we asked our client to Gamestorm with us. The purpose of this gamestorming was to break the ice, create more clarity in terms of scope and what was achievable in a 2-week sprint, and help our client answer two main questions for us:
1) What kind of alerts could we have on our dashboard to help our users take action in a timely manner?
2) What are the actions our users might have to take based on the info that is presented to them?
2) What are the actions our users might have to take based on the info that is presented to them?

Deep-r Dashboard
Gamestorming with Client
Sandbox Concept
Gamestorming with Client
Sandbox Concept
As we explored “the Sandbox” concept, it made more sense for the environment to automatically generate optimized scenarios to help user choose the most cost and time efficient way to deliver product from the refinery to the storage terminal. Deep-R would use machine learning and AI to gather the required data. However, since even the most intelligent devices are not error-free and there might be so many other factors and situations that could affect the decisions that users might make including, but not limited to environmental, political, or local constraints, in addition to automatic optimization, we decided to create a calculator that would give users the ability to add constraints and override automatic scenarios. Each scenario would show the cost, the estimated time, and the consequences that users might face if they choose them. Users have the ability to compare scenarios, save them for future references, and print them to run by executives or board members.
We later called Sandbox “Simulation” and separated it from the main dashboard by putting it on its own page.
Upon opening the Simulation the users are able to:
Automatically explore scenarios to improve operational efficiency
Read and act upon alerts and recommendations
View saved optimization scenarios
Automatically explore scenarios to improve operational efficiency
Read and act upon alerts and recommendations
View saved optimization scenarios
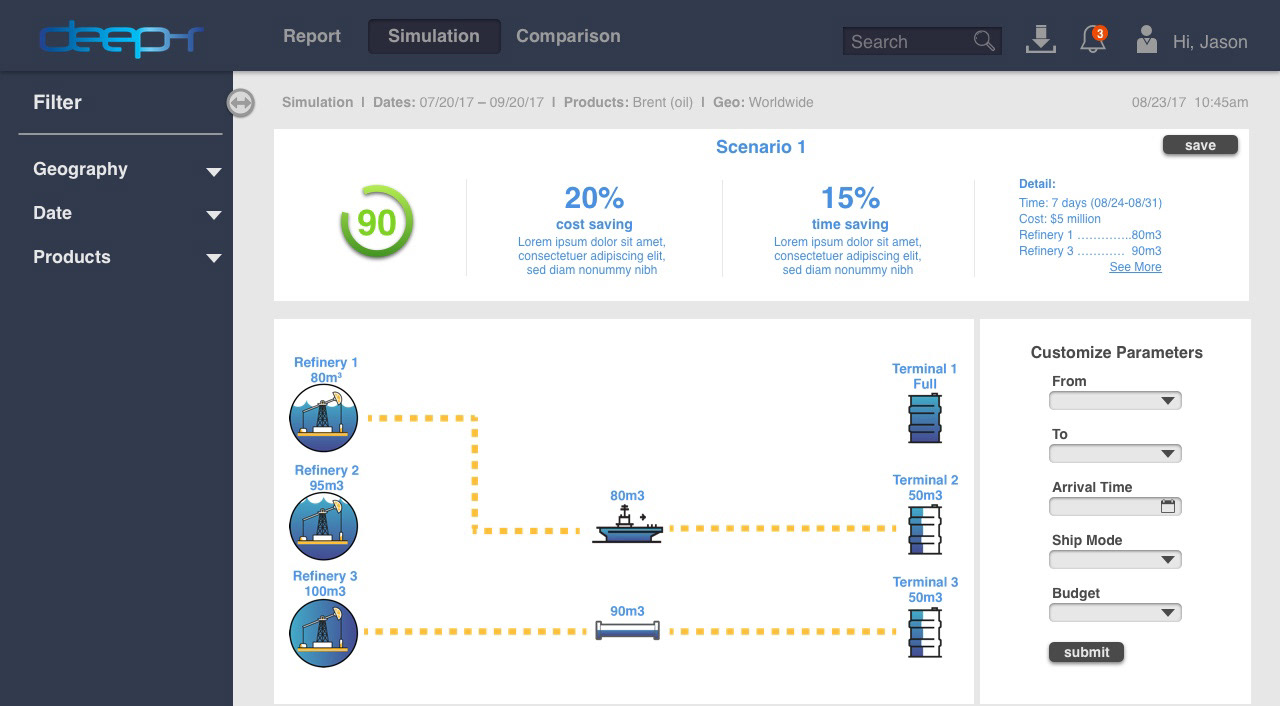
Deep-r Dashboard
Optimization Page
Optimization Page
Mobile View
Based on our conversations with potential end users in oil & gas industry, we found out that while B2B dashboards are very complex and not mobile-friendly, users need to often have access to their dashboards on their phones and tablets and when they are on the go in order to take immediate actions on high level alerts. Our client, Deep-R had developed their first version of their dashboard as a scalable responsive web-based dashboard. However, there were still too much information on a mobile view as it would scale down. In our version, we suggested that Deep-r would sort less frequently used items under a hamburger menu, and only show the summary and the panels stacked on top of each other.
Based on our conversations with potential end users in oil & gas industry, we found out that while B2B dashboards are very complex and not mobile-friendly, users need to often have access to their dashboards on their phones and tablets and when they are on the go in order to take immediate actions on high level alerts. Our client, Deep-R had developed their first version of their dashboard as a scalable responsive web-based dashboard. However, there were still too much information on a mobile view as it would scale down. In our version, we suggested that Deep-r would sort less frequently used items under a hamburger menu, and only show the summary and the panels stacked on top of each other.

Deep-r Dashboard
Mobile View
Mobile View
Next Steps
At the end of the third week, we presented our research findings and our proposed solution to Deep-r team.
At the end of the third week, we presented our research findings and our proposed solution to Deep-r team.
We reminded them that we had to make a lot of assumptions since we only had access to users in upstream. We asked our client to:
Since different users and industries have very different needs, if Deep-r decides to expand their business, whether it is in other countries, or different industries, we suggested that they would consider using a customizable dashboard and data visualization service, such as Tableau, Logi, or Kibana
In terms of design, there are important pages that have not been designed yet; Admin Page, Account Page, and Report page, to name a few
We also recommended that Deep-r would create a Native Mobile App for their mobile users
Impact
The executives at Deep-r very happy with our work. At the end of our presentation, one of the founders said: “You took our vision and gave us something better!”, which made us feel very happy and accomplished, as we had fulfilled our duty as UX consultants.
The executives at Deep-r very happy with our work. At the end of our presentation, one of the founders said: “You took our vision and gave us something better!”, which made us feel very happy and accomplished, as we had fulfilled our duty as UX consultants.
Deep-r is going to conduct series of usability testing with their end users in Mexico City and Madrid. They will contact us if they need our help anywhere in the process. We hope to be able to see the dashboard live by the end of the year.